Generates a Flow Accumulation raster using the Deterministic 8 (D8) flow direction model.
Inputs:
A D8 Flow Direction raster dataset.
Output raster name and format
Outputs:
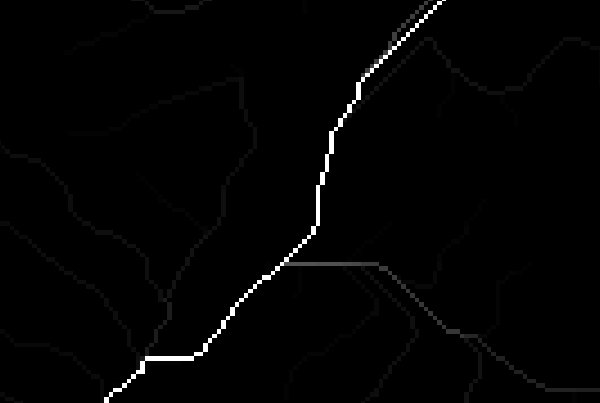
A Flow Accumulation raster.
Example:
An example of Flow Accumulation D8 result.
Notes:
The value for each cell in the Flow Accumulation raster is the total number of cells which flow into it
including the cell itself. So for a cell with no inflowing cells the value will be 1.
The value in the Flow Accumulation raster represents the number of upstream cells from which the water
flowing downstream will pass through the current cell.
The actual contributing area for the cells can be determined by multiplying the accumulation value by the area represented by a cell.
Thus for a raster with cell size 1 x 1 meter the values are directly square meters. For a cell size of 10 x 10 meters, the
accumulated value must be multiplied by 100 to obtain the contributing area.
Cells with a high value in the Flow Accumulation raster indicate high concentration of water and can be used for identification of streams.