Feature layers loaded in the Map can be added to the Profile window and draped on a profile by selecting File Menu ==> Add Layer. Depending on the type of layer to be added, the following is displayed in the Profile Window:
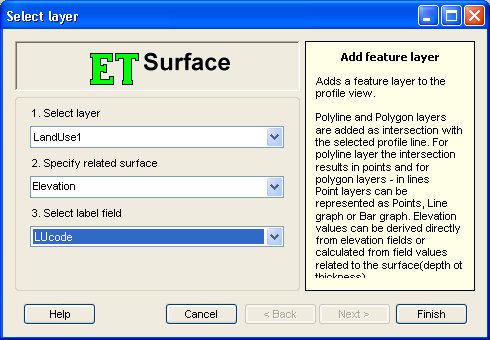
Selecting File Menu ==> Add Layer open the Select Layer dialog.
If the selected layer is of type Polyline or Polygon, the user has to specify the related Surface on which the layer will be draped and a label field, the values from which will be used for labeling the features.
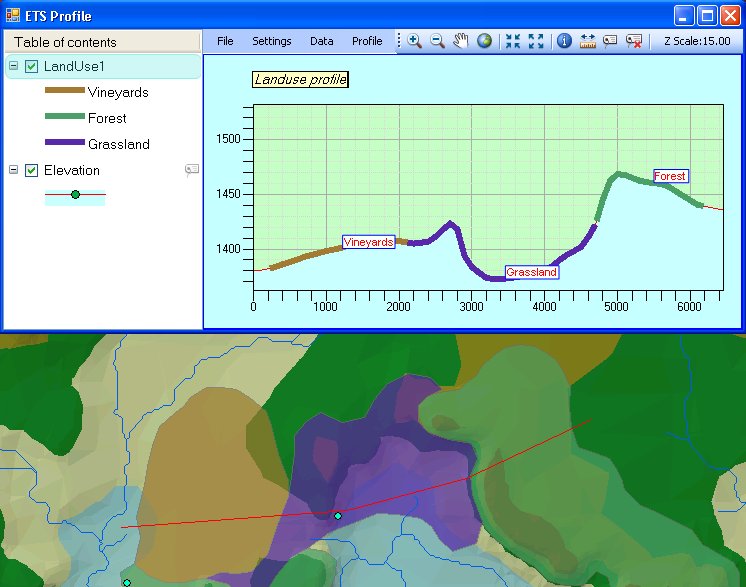
A sample display for a Polygon layer. To change the display, right click on the layer in the TOC and select "Properties" - see Layer Properties.
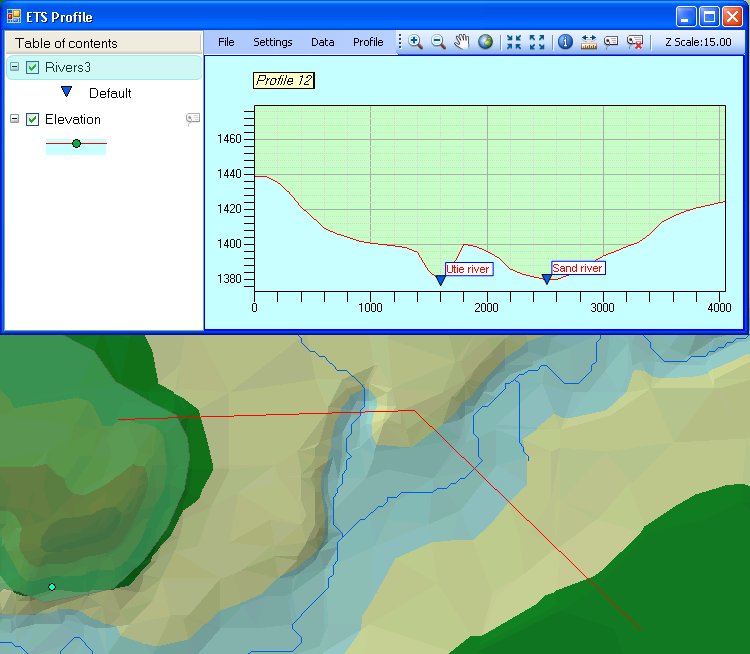
A sample display for a Polyline layer. To change the display, right click on the layer in the TOC and select "Properties" - see Layer Properties.
If the selected layer is of type Point the user has to define additionally the Buffer distance which will be used for the point selection.
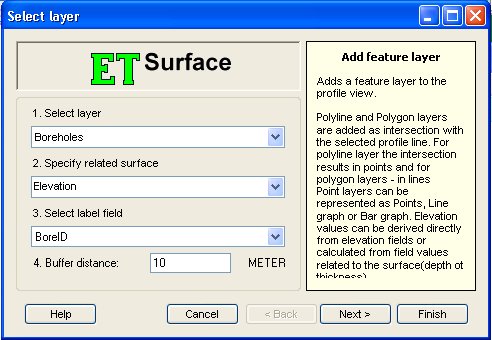
By selecting "Finish" at this stage, all points within the buffer area of the Profile Polyline will be selected and displayed with their surface value in the Profile window.
By selecting "Next" the user can set additional properties for the display
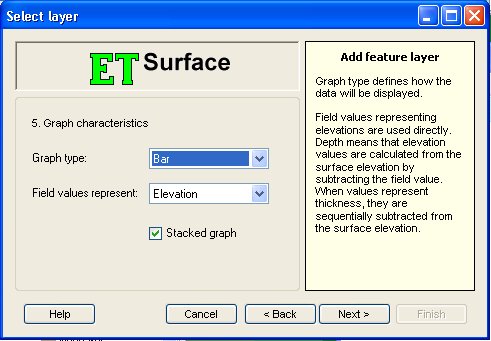
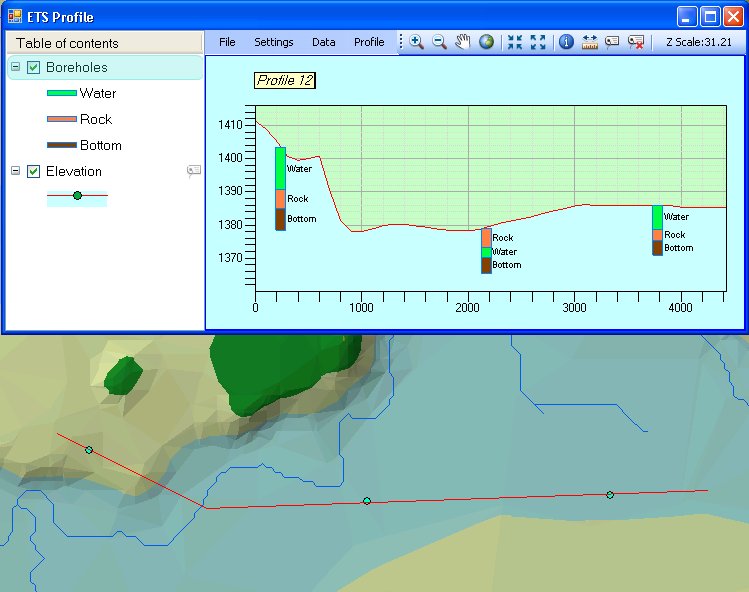
The Graph type can be Point, Line or Bar. In order to display Line or Bar graphs, additional values derived from fields need to be specified.
The field values can represent Elevation, Depth or Thickness and the calculation of the resulting heights are based on this selection. Elevation values are derived directly from the field. Depth values are subtracted from the Surface value at the point to calculate the elevation. Thickness values are used to sequentially subtract the thickness from the previous elevation value.
If the field values represent Elevation or Depth, the user can specify that the graph is stacked - meaning all height values are calculated and sorted and drawn sequentially from top to bottom. If the "Stacked graph" option is not checked, each line or bar starts from the Surface value to the calculated elevation.
By selecting "Next" the user goes to the next step - selection of fields.
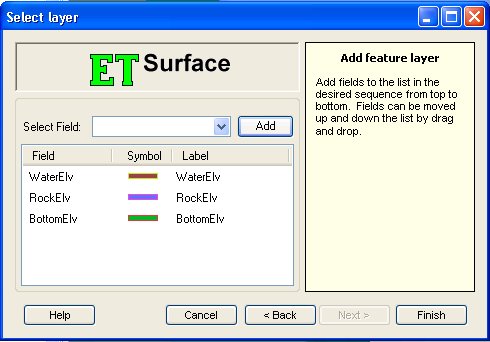
Select and add all field from which values for the graph will be derived. The Label column can be edited to change the label, which will be displayed. The table rows can be moved up and down to change the sequence of calculating elevations. Please note that in some cases the sequence does not have an influence on the display - for example if the selected Graph type is Point or if the Stacked option is selected.
Sample display for Point layer. To change the display, right click on the layer in the TOC and select "Properties" - see Layer Properties.