For users of ArcGIS Desktop ET Surface toolbar provides the following functionality:
The selection combo box is used to set the current surface layer.
![]()
The Profiling tools ![]() are used to create profiles
in the Profile Extractor - see the Profile Extractor pages for detailed information.
are used to create profiles
in the Profile Extractor - see the Profile Extractor pages for detailed information.
Line of Sight tools ![]() are used to create Line of
Sight profiles in the Profile Extractor - see the Line of Sight pages for detailed information.
are used to create Line of
Sight profiles in the Profile Extractor - see the Line of Sight pages for detailed information.
The Digitize PointZ ![]() ,
PolylineZ
,
PolylineZ ![]() and PolygonZ
and PolygonZ ![]() tools extract for each geometry digitized the Z values from the surface selected in the Surface Layer box and create Z shapes.
tools extract for each geometry digitized the Z values from the surface selected in the Surface Layer box and create Z shapes.
If the user digitizes polylines or polygons new vertices are introduced in the digitized geometry depending on the source surface:
The tools can be used to digitize features or graphics
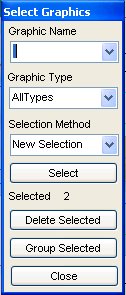
The tools of ET Surface draw many graphics elements on the view. This tool ![]() allows to manage these graphics elements with ease. It opens the following form:
allows to manage these graphics elements with ease. It opens the following form:
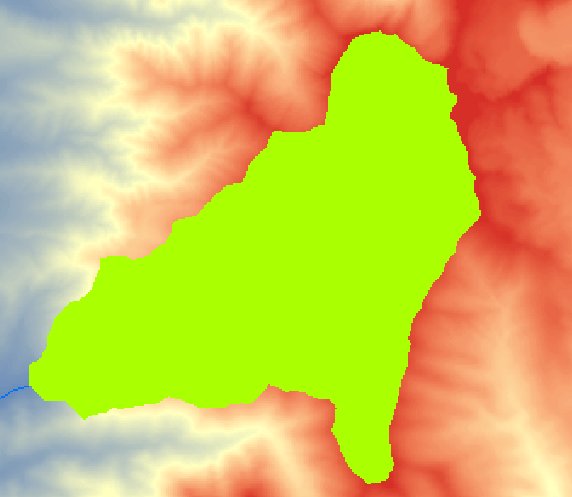
The Watershed tool ![]() is used to delineate a Watershed for a selected
point on the surface. The delineation is based on a D8 Flow Direction raster which has to be selected in the Combo box.
is used to delineate a Watershed for a selected
point on the surface. The delineation is based on a D8 Flow Direction raster which has to be selected in the Combo box.
For better
visualization the DEM raster should be displayed on top of the Flow Direction raster.
The delineation is usually done for a point
on a stream and if there is no Stream layer available sometimes it is difficult to select the correct location. In such a case it is
useful to use the Flow trace tool to create a Flow path and then use the Watershed tool based on the flow path.
An example of the Watershed tool output.
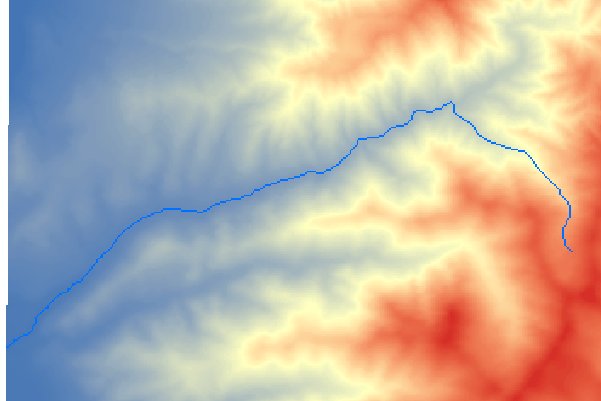
The Flow Trace tool ![]() is used to create a Flow path for the water from
the specified point over the terrain to the Outlet. A Flow Direction D8 raster has to be selected in the Combo box in order to
use the tool.
is used to create a Flow path for the water from
the specified point over the terrain to the Outlet. A Flow Direction D8 raster has to be selected in the Combo box in order to
use the tool.
An example of the Flow Trace tool output.
The Raster Cell Inspector tool  is used to view cell values of the
Raster dataset selected in the Selection Combo box. It will display the value of the cell under the cursor as well as the
neighbouring 8 cells.
is used to view cell values of the
Raster dataset selected in the Selection Combo box. It will display the value of the cell under the cursor as well as the
neighbouring 8 cells.
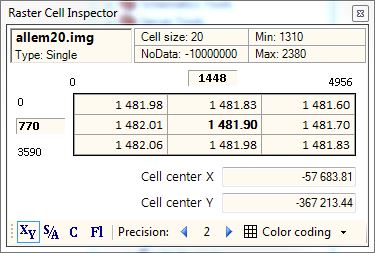
As the mouse pointer is moved over the Raster with pressed left button, the values will change for the current cell under the cursor.
The Cell inspectow window contains other useful information - the current raster cell size, data type, minimum and maximum values, and the NoData value.
The current cell position in the raster is shown in the boxes above and on the left side of the cell values grid - X from left to right from 0 to the maximum width and Y from top to bottom from 0 to maximum height.
The two boxes below the cell values grid display information based on the selection at the bottom of the form as follows:.
 is selected - the X and Y coordinates of the current cell center.
 is selected - the slope and aspect of the surface in the current cell.
 is selected - the plan and profile curvature in the current cell.
 is selected - the flow direction (D8 and D-inf) in the current cell.
The precision of the displayed values can be increased and decreased with the precision arrows.
The Color coding drop-down allows for color coding of the minimum and maximum values displayed in the cell values grid.