ET Surface Hydrological Functions
The Hydrological Functions are used to model the flow of water over the terrain represented by a raster Digital Elevation Model (DEM). The availability of Digital Elevation data has increased significantly over the last years. The advances in technology have allowed also for increased accuracy and resolution.
The Hydrology functions in ET Surface include the following:
- Analyse the DEM Raster for areas for which the flow can not be determined (NoFlow areas) - sinks and flat areas
- Remove NoFlow areas and create "Depressionless" DEM.
- Model the flow of water over the DEM and create Flow Direction and Flow Accumulation rasters
- Delineate Stream Network from Flow Accumulation rasters, assign Strahler Stream Order and Stream Link IDs to stream sections.
- Create Stream polyline features and Node point features of the Stream network.
- Delineate Watersheds
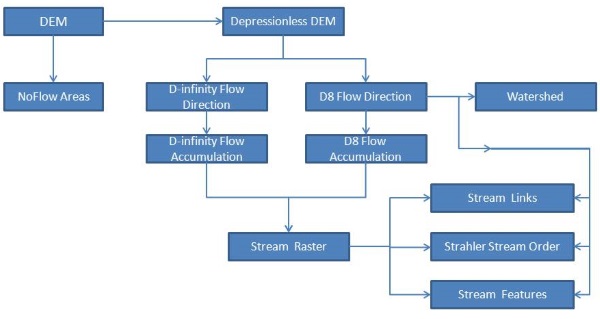
The starting point for any hydrological analysis is a Digital Elevation Model. Usually there are a number of steps which have to be followed for performing a specific task. The following flowchart shows the sequence of steps for using the provided functionality:
DEM Pre-Processing
The most common digital data of the Earth's surface is raster digital elevation models (DEMs). And because the flow of water is determined by the terrain it has become more common to use DEMs for the analysis of hydrological processes.
All the functions in the Hydrology group are based on a raster Digital Elevation Model.
In order to use a DEM for hydrologic analysis it is important that the flow of water can be defined for each cell of the DEM raster and then following the flow direction it is possible to reach the DEM edge.
Depressions (also known as pits or sinks) are areas in the DEM which do not allow the flow of water to an outlet at the edge of the DEM. They may be representative of the natural terrain, but could also be result from the technical procedures in the DEM production.
In order to use a DEM for hydrological modeling, it is important to eliminate depressions.
ET Surface includes a function for finding the problem areas (NoFlow Areas) and a function for removing them (Fill Depressions).
NoFlow Areas analyses the DEM by inspecting each cell and its 3x3 neighborhood and marks the NoFlow Areas.
An output value of 1 indicates that the cell belongs to a flat area - there is no lower neighboring cell and the lowest neighbor has the same elevation.
An output value of 2 indicates a sink - meaning that all neighboring cells are with higher elevation.
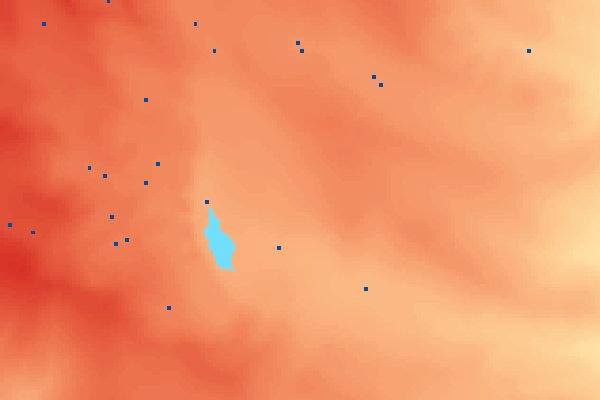
An example of the NoFlow Areas output - Flat areas with light blue and Sinks with dark blue.
Fill Depressions removes the NoFlow areas from the DEM using the algorithm proposed by Planchon and Darboux (2001). It removes sinks and flat areas by increasing the elevation of NoFlow cells in such a way that all inner cells of the DEM have a defined flow. The resulting DEM can be called "depressionless"
In flat areas first the cells with defined flow at the boundary are established and then the elevation of neighboring cells is increased with a minimal slope.
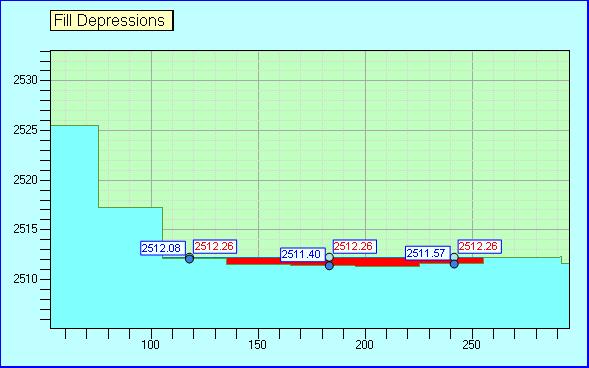
Filled depression view in the Profile Extractor - the red area shows cells where a depression was filled.
Flow Direction and Accumulation
There are a number of algorithms for determination of flow over a DEM. At present ET Surface has implementations for two of them:
- Deterministic 8 (D8) proposed by O'Callaghan and Mark (1984).
- Deterministic Infinity (D-infinity) proposed by Tarboton (1997).
The D8 method
The D8 method is the most widely used and has been mplemented in many software packages. In this model the flow direction for each cell is determined according to the steepest descent to one of its 8 neighboring cells. The direction values are most often coded as 1,2,4,8,16,32,64 and 128 according to the figure below:
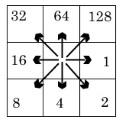
Thus if the steepest descent of a cell is to the left, its Flow direction will be coded as 1, if it is to upper right, it will be coded as 32. The steepest descent is calculated by dividing the elevation difference by the distance between the cell centers.
Once the Flow Direction is defined, the next step is to determine the Flow Accumulation. The value in the Flow Accumulation raster represents the number of upstream cells from which the water flowing downstream will pass through the current cell. The calculation is done from the Flow Direction raster starting from the top - the cells to which there is no contribution and passing their accumulated value downslope.
In ET Surface the Flow Accumulation values represent number of cells. The actual contributing area for the cells can be determined by multiplying the accumulation value by the area represented by a cell.
Thus for a raster with cell size 1 x 1 meter the values are directly square meters. For a cell size of 10 x 10 meters, the accumulated value must be multiplied by 100 to obtain the contributing area.
Cells with a high value in the Flow Accumulation raster indicate high concentration of water and can be used for identification of streams.
The D-infinity method
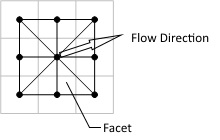
The D-infinity method was suggested by Tarboton (1997). In it Flow Direction is defined as the angle of the steepest descent determined by analysis of 8 triangular facets formed by the 3x3 cell neighborhood.
The triangular facets are formed by the centers of the center cell and its 8 neighbors. The flow direction for a particular facet is the direction of the steepest downward slope on the facet. The flow irection for the cell is the one with the highest magnitude of all the eight facets. The possible values are in decimal degrees from 0 to 360 starting from North in clockwise direction.
For example a value of 90 indicates flow to the East and a value of 225 - flow to South West.
The D-infinity method allows flow divergence - the flow from a cell will either go to one or two of the neighboring cells. This is a better representation of water flow on divergent slopes.
Thus a flow accumulation value of 100 in a cell can be distributed between two neighboring cells transferring respectively 65 to the one and 35 to the other.
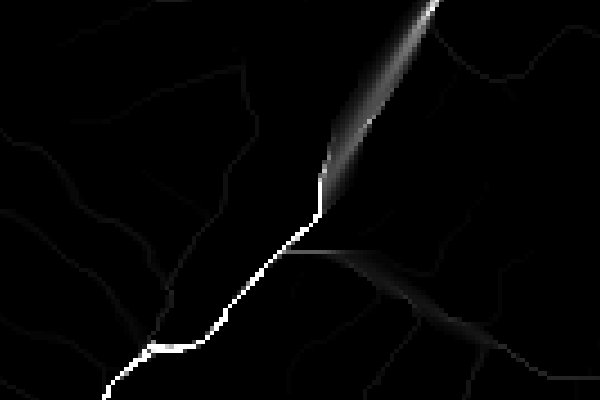
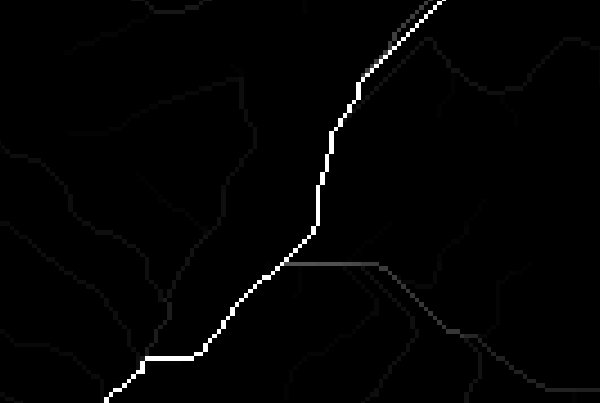
An example of Flow Accumulation D-infinity result (above) and Flow Accumulation D8 (below).
Note the dispersion of flow in the D-infinity result compared with the concentrated flow in D8.
Delineation of Stream network
The Flow Accumulation raster is used for Stream delineation. As we saw previously, the Flow Accumulation raster values represent the number of upslope cells flowing through each cell. By applying a Threshold value to the Flow Accumulation raster we can determine the cells which form a Stream network. All cells with Flow Accumulation value above the threshold are considered to be part of a stream.
The threshold is called Stream Initiation Threshold (also Channel Initiation Threshold). It represents the minimum contributing area required to initiate and maintain a Stream. The determination of the threshold value will depend on several factors including the type of the terrain, climate, soils and the DEM resolution.
Reviewing existing data and maps for the area and experimentation with different values are helpful for the determination of the threshold value. Lower values will result in denser Stream Network.
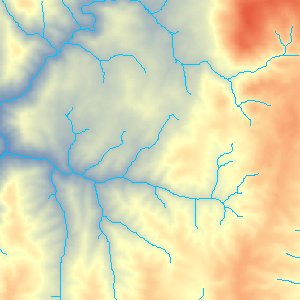
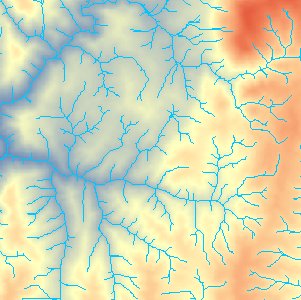
The following images show the difference in Stream density at Threshold values of 1000 and 100
When using Flow Accumulation raster produced with the D8 method, the increase of values downslope is guaranteed, since each cell can only flow to one neighbor.
This is not the case with Flow Accumulation created by the D-infinity method. There the accumulated value for a cell can be distributed to two neighboring cells, thus causing reduction of the accumulation. This can lead to disconnected streams after the Stream Initiation Threshold is applied.
To circumvent this the D-infinity Flow Accumulation function in ET Surface provides the option to use the D8 accumulation method once the Threshold is reached. In this case the user has to specify the Threshold and provide a D8 Flow Direction raster as input.
Stream functions
The Stream Link function assigns unique values to sections of the Stream Network. It uses as input the Streams raster and the D8 Flow Direction raster.
A Link is each section of Stream between two junctions, the stream head and a junction or a junction and the outlet.
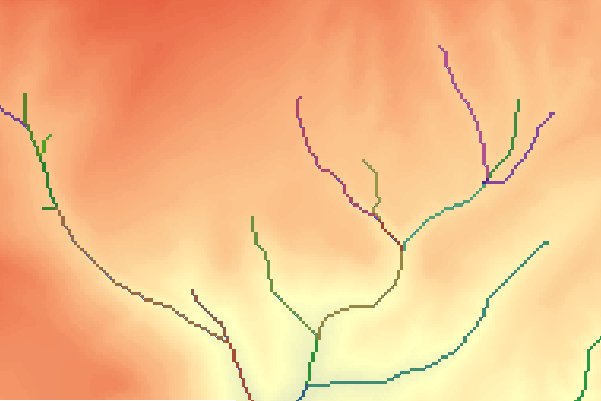
An example of Stream Link output.
The Strahler Stream Order function assigns an order to each stream segment according to the system proposed by Strahler (1952). The order of the stream section starting at the stream head is assigned to 1. The order increases by 1 only when two sections of the same order intersect. For example if two sections of order 1 intersect, the following section will be assigned an order of 2. When two sections of different order intersect, the following section preserves the higher order.
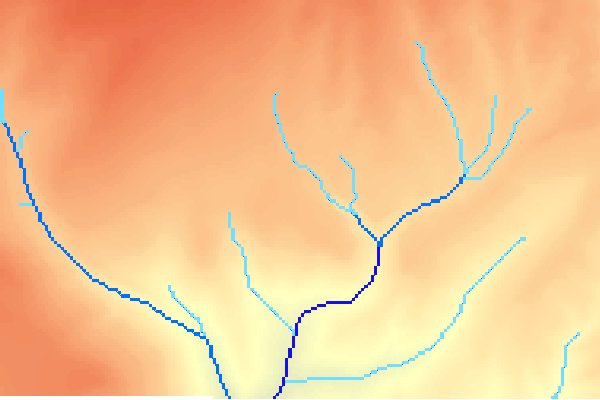
An example of Strahler Stream Order result.
The Stream Raster To Features function converts a Stream raster to a polyline feature class and optionally creates a point feature class with the Nodes of the stream network. It requires the D8 Flow Direction raster as input to determine the correct direction of flow.
Each polyline in the output feature class represents a section of the stream and is assigned a unique ID. The start and end nodes are recorded as attributes. The direction of the polyline is always downstream.
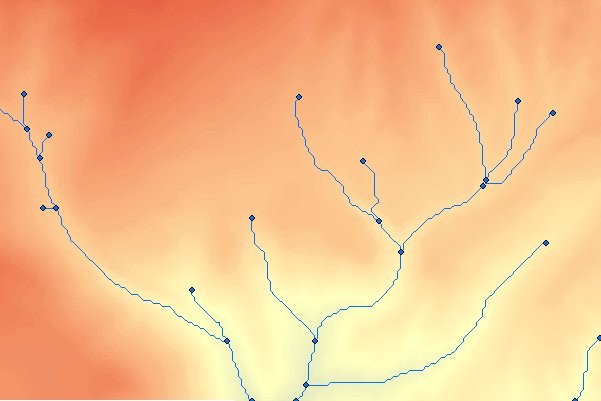
An example of Stream Raster to Features output - Streams and Nodes.
Watershed
The Watershed function delineates the area contributing flow to a set of Outlet points. The Outlet is the lowest point in the Watershed.
Watersheds are delineated from the D8 Flow Direction raster. An optional Outlets feature class can be specified as input. In this case Watersheds are delineated for the Outlet points. An ID is assigned to
If no Outlet points are specified, all Outlets for the DEM are determined (the points at which flow leaves the DEM) and Watersheds are delineated for them. In this case the Watersheds are assigned unique generated values starting from 1.
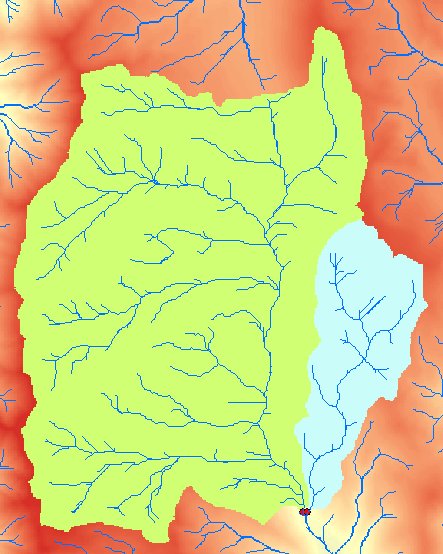
An example of Watershed output using Outlet points .
If Outlet points are specified it is recommended to ensure that they are within cells with sufficient flow to delineate a reasonable Watershed. Otherwise it is possible only a few cells (or even just one) to be delineated.
For this the Snap Pour Points function can be used. It allow the Outlet points to be moved within a specified distance based on the values of a reference raster.
There are three Snap options:
- Snap to nearest Stream
- Snap to lowest Elevation
- Snap to highest Flow Accumulation
The relevant raster and maximum snap distance have to be provided as input parameters.
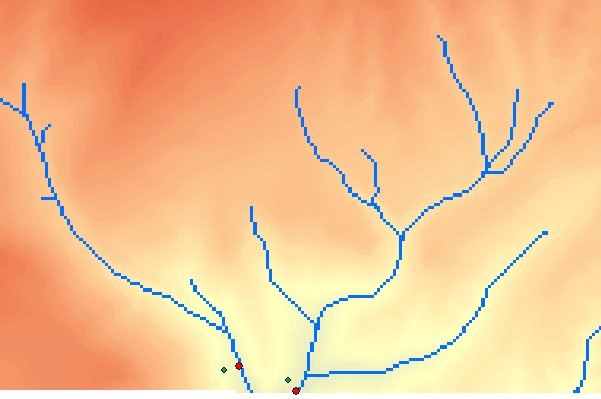
An example of Snap Pour Points using the Stream option - initial points in green and after snapping in red.
Streams And Watershed
The Streams And Watershed function allows the creation of Stream and Node features as well as a Watershed raster from a DEM, The function calculates as temporary datasets the required Flow Direction and Flow Accumulation rasters based on the selected flow model (D8 or D-infinity).
If the D-infinity flow method is selected, the flow accumulation below the specified Stream Initiation Threshold is determined by the D-infinity method and above the threshold the D8 method is used.
The Watershed Raster represents Watersheds for all Outlet points determined from the Flow Direction raster and Watershed IDs are automatically generated.
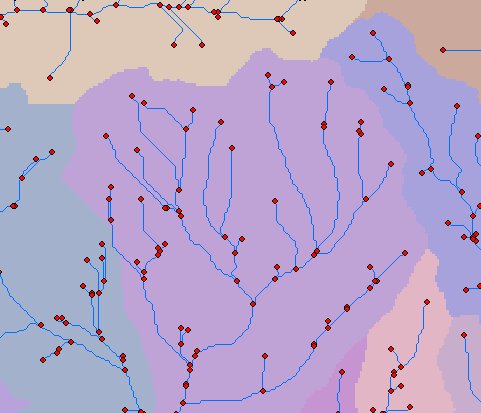
An example of Streams And Watershed output - Streams and Nodes Features and Watershed raster.
References
- O’Callaghan, J. F., and Mark, D. M., (1984). "The extraction of drainage networks from digital elevation data", Computer Vision, Graphics and Image Processing, Vol. 28, pp. 328-344.
- Planchon, O. and F. Darboux, (2001), "A fast, simple and versatile algorithm to fill the depressions of digital elevation models", Catena, 46: 159-176.
- Tarboton, D. G., (1997), "A New Method for the Determination of Flow Directions and Contributing Areas in Grid Digital Elevation Models", Water Resources Research, 33(2): 309-319
- Tarboton, D. G., R. L. Bras and I. Rodriguez-Iturbe, (1991), "On the Extraction of Channel Networks from Digital Elevation Data", Hydrologic Processes, 5(1): 81-100.